Cloud Gaming vs. Native Hardware: Infrastructure Breakdown, Latency Analysis, and Market Outlook
By Sohail Shabbir · Games & Gaming · Thu Aug 06 2026
A comprehensive engineering breakdown comparing cloud gaming architecture and native hardware execution, featuring latency analysis, video compression dynamics,
Cloud Gaming vs. Native Hardware: Infrastructure Breakdown, Latency Analysis, and Market Outlook
An engineering-level examination of data center infrastructure, real-time video encoding pipelines, frame-by-frame latency budgets, total cost of ownership (TCO), and the strategic trajectory of interactive cloud streaming through 2026 and beyond.

1. Executive Summary & Paradigm Overview
The interactive entertainment sector is undergoing a profound structural shift. For four decades, consumer gaming has relied on local native execution: custom computing platforms—ranging from personal computers equipped with discrete Graphics Processing Units (GPUs) to dedicated video game consoles—processing game state logic, rendering 3D geometries, and outputting uncompressed video frames directly to local display panels via display interfaces like DisplayPort and HDMI.
Concurrently, the maturation of hyperscale cloud infrastructure, edge computing nodes, low-latency video codecs, and high-speed fiber-optic and 5G telecommunication networks has enabled cloud gaming (also known as gaming-as-a-service or cloud streaming). Services such as NVIDIA GeForce NOW, Xbox Cloud Gaming, PlayStation Plus Cloud Streaming, and Amazon Luna execute game binary logic inside remote server infrastructure, encode rendered frames into real-time H.265 or AV1 video streams, and transmit those packets back to lightweight client terminals over the public internet.
This technical breakdown provides a rigorous, engineering-grade comparative analysis between cloud gaming architecture and native hardware execution. We explore server-side GPU virtualization, network transit topologies, sub-millisecond pipeline latency breakdowns, video compression trade-offs, financial total cost of ownership models, and market trajectory projections through 2030.
2. Infrastructure & Architectural Breakdown
Understanding the fundamental distinction between cloud and native gaming requires analyzing the underlying architectural stack from hardware interfaces up to virtualized hypervisors.
Server-Side Cloud Infrastructure & GPU Virtualization
Cloud gaming data centers rely on specialized server racks engineered for parallel throughput, massive multi-tenant isolation, and immediate hardware video encoding. Unlike standard web server cloud nodes running stateless microservices, cloud gaming servers demand predictable real-time GPU scheduling and unthrottled hardware pipelines.
- GPU Slicing & Hypervisors: Cloud providers utilize technology such as NVIDIA vGPU (Virtual Compute Server / vWS) or Single Root I/O Virtualization (SR-IOV). A single high-density enterprise GPU (such as the NVIDIA L40S or custom RTX 4090 server variants) is partitioned into multiple virtual GPU instances. Each virtual machine (VM) receives dedicated CUDA cores, RT (Ray Tracing) cores, and hardware video encoders while sharing the underlying PCIe backplane.
- Hardware Encoder Blocks (NVENC / VCN): Rendered frame buffers are captured directly from VRAM avoiding host RAM copies via zero-copy APIs (such as NvFBC or DirectX Video Acceleration). Dedicated hardware blocks (NVENC Eighth Gen or AMD VCN) compress raw 4K RGBA frames into H.265/HEVC or AV1 bitstreams within 1.5 to 3.0 milliseconds per frame.
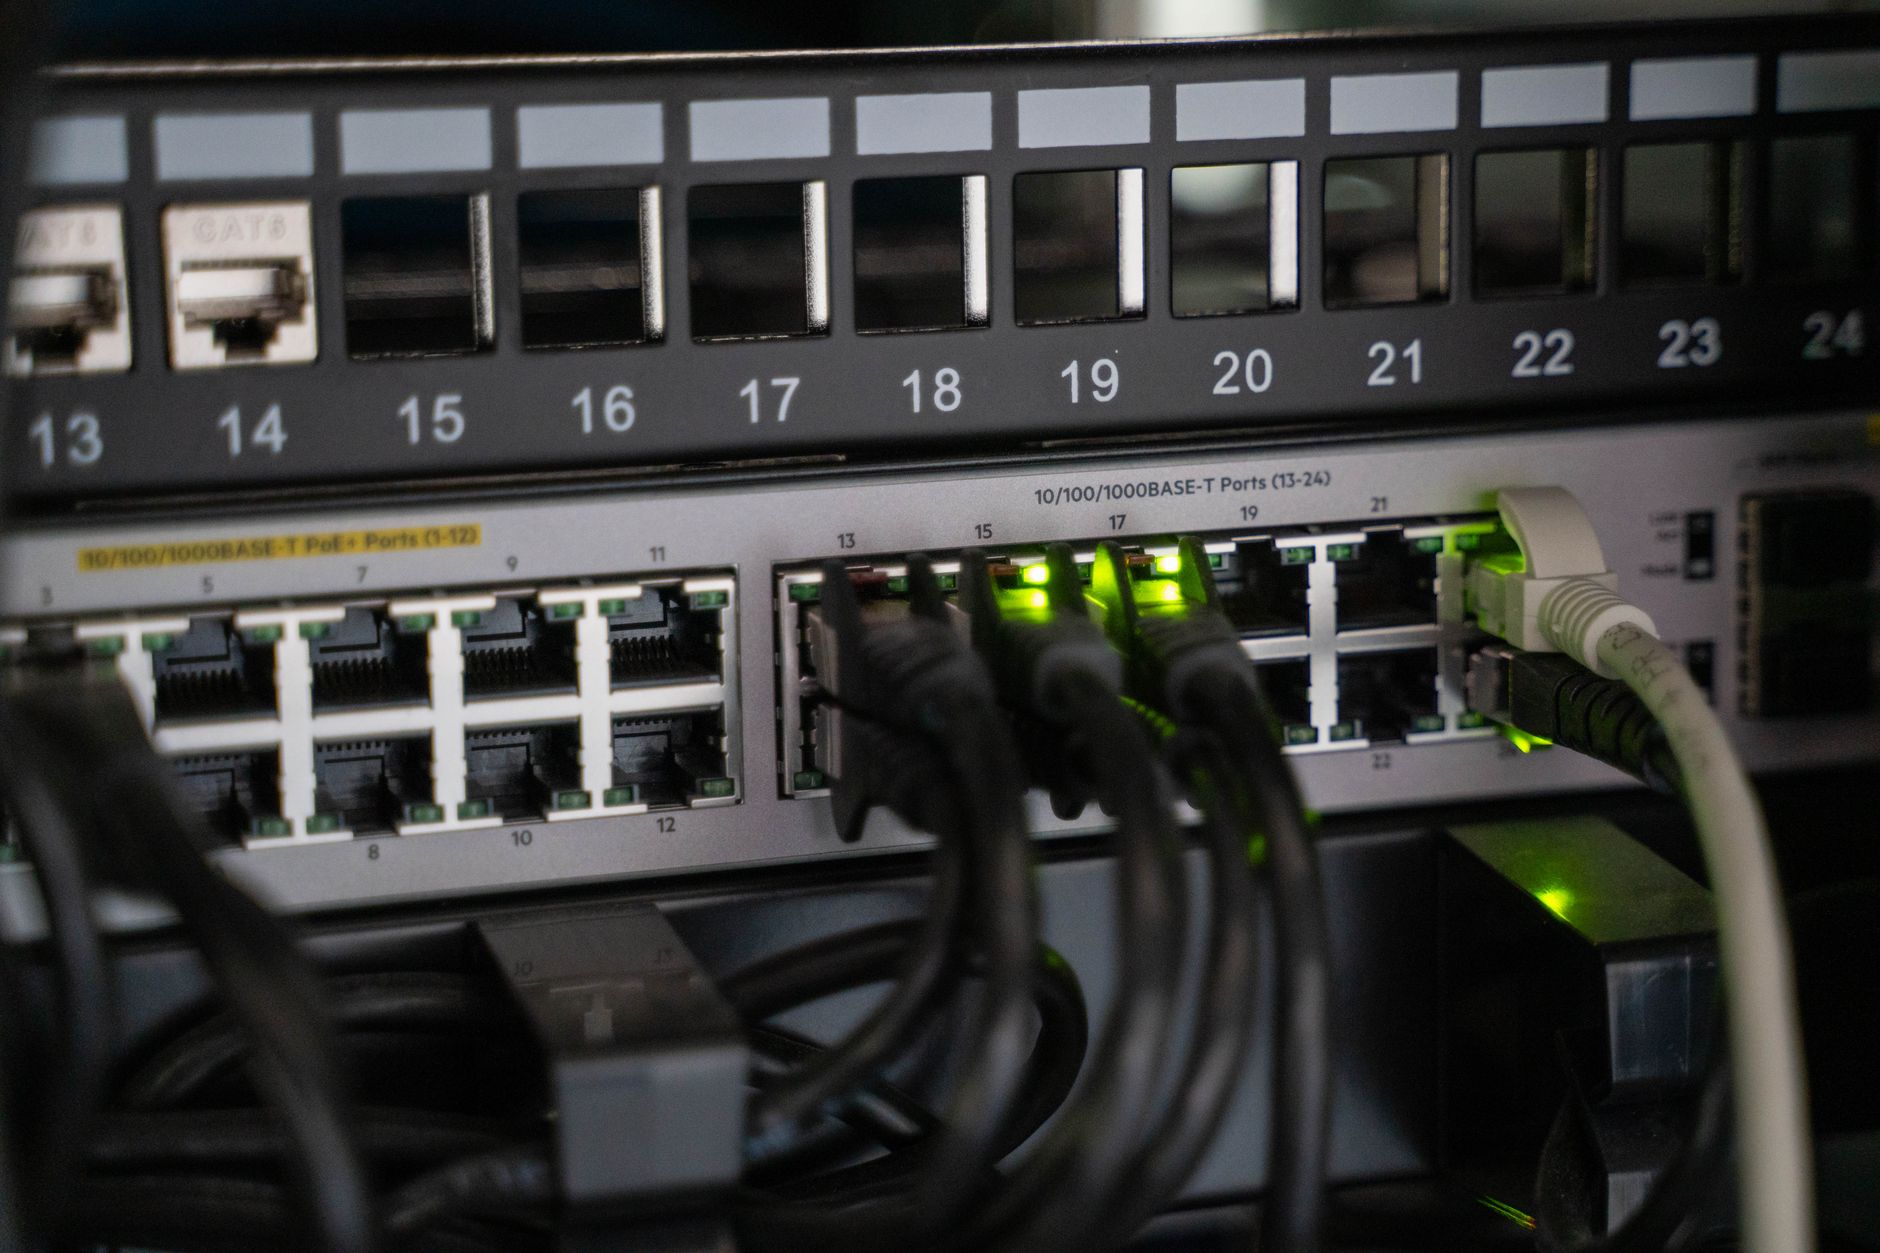
- Edge Data Centers & ISP Peering: To minimize network propagation delays, cloud providers deploy edge nodes directly inside Internet Exchange Points (IXPs) and regional central offices (COs). Direct BGP peering agreements between cloud operators (e.g., Microsoft Azure, AWS, NVIDIA SuperPOD facilities) and consumer ISPs eliminate routing hops over the public internet backbone.
Native Hardware Local Architecture
In contrast, native desktop PCs and modern consoles (PlayStation 5, Xbox Series X) eliminate network transit entirely, optimizing for local interconnect bandwidth and direct memory access.
- PCIe 5.0 and DirectStorage: Modern native platforms utilize PCIe 5.0 x16 buses capable of transferring data at up to 64 GB/s bi-directionally. Microsoft DirectStorage and custom console I/O coprocessors stream compressed game assets directly from NVMe SSDs to VRAM without CPU intervention, reducing loading times and eliminating streaming hitches during real-time gameplay.
- Uncompressed Video Output: Native GPUs transmit uncompressed pixel streams to monitor display engines via DisplayPort 2.1 or HDMI 2.1a interfaces operating at up to 80 Gbps. This guarantees 10-bit HDR, uncompressed 4:4:4 color depth, zero compression artifacts, and zero video encoding/decoding overhead.
3. Quantitative Latency Analysis & Frame Pipeline Deep-Dive
Latency—specifically total "Motion-to-Photon" (MTP) latency—is the defining technical bottleneck for cloud gaming platforms. MTP latency represents the elapsed time from the moment a user performs a physical input (e.g., clicking a mouse button or pressing a game controller trigger) to the exact instant the corresponding updated frame pixels emit light from the display monitor.
The Motion-to-Photon Latency Equation
Total latency can be mathematically expressed as the summation of discrete micro-stages:
Let us analyze each micro-stage across Native PC (240Hz), Native Console (60Hz), and Cloud Streaming (120Hz Stream):
| Pipeline Stage | Native High-End PC (240Hz) | Native Console (60Hz) | Cloud Gaming (GFN 120Hz / 15ms RTT) |
|---|---|---|---|
| 1. Input Sensing & USB Polling | 1.0 ms (1000Hz polling) | 4.0 ms (250Hz BT/USB) | 1.0 ms (DirectInput / WebRTC) |
| 2. Game Engine & Logic CPU Thread | 2.5 ms | 16.6 ms (1 frame @ 60fps) | 4.1 ms (1 frame @ 240fps server) |
| 3. GPU Rendering & Post-Process | 3.0 ms (NVIDIA Reflex On) | 16.6 ms | 4.1 ms |
| 4. Hardware Video Encoding | 0.0 ms (N/A) | 0.0 ms (N/A) | 2.5 ms (NVENC AV1 Slicing) |
| 5. Network Transit & ISP Routing (RTT/2 + Input) | 0.0 ms | 0.0 ms | 15.0 ms (Fiber optic 50km hop) |
| 6. Client Video Decoding | 0.0 ms (N/A) | 0.0 ms (N/A) | 2.2 ms (Hardware H.265 Decoder) |
| 7. Display Scanout & Pixel GtG Response | 4.1 ms (240Hz OLED) | 16.6 ms (60Hz TV, Game Mode) | 8.3 ms (120Hz Mobile/Monitor OLED) |
| TOTAL MOTION-TO-PHOTON LATENCY | ~11.6 ms | ~53.8 ms | ~37.2 ms |
Remarkably, as demonstrated in the latency matrix above, high-frame-rate cloud streaming (such as NVIDIA's 240Hz/120Hz cloud modes) over a fast fiber network can actually yield lower total input-to-display latency (~37 ms) than a standard native console running on a typical 60Hz television screen (~54 ms). However, compared to a native 240Hz esports PC setup (~11.6 ms), cloud gaming still carries a ~25ms latency penalty inherent to light propagation through optical fiber and packet serialization overhead.
Python Simulation Model: Motion-to-Photon Latency Calculator
To quantify network jitter and packet loss effects on motion-to-photon latency, software engineers use Monte Carlo simulation scripts. Below is an executable Python script illustrating how jitter distributions affect perceived latency percentiles (P50, P95, P99):
import numpy as np

def simulate_cloud_gaming_latency(num_frames=10000, base_rtt_ms=15.0, jitter_std_ms=2.5, packet_loss_rate=0.01):
    # Fixed pipeline hardware stages (in milliseconds)
    input_polling = 1.0
    server_render = 4.1  # 240Hz server render queue
    video_encode = 2.2   # Hardware AV1 slicing
    client_decode = 2.0  # Local GPU video decoder block
    display_refresh = 4.1 # 240Hz client display scanout

    # Simulate network transit with Gaussian jitter
    network_one_way = np.random.normal(loc=base_rtt_ms / 2.0, scale=jitter_std_ms, size=num_frames)
    network_one_way = np.maximum(network_one_way, 3.0) # Physical minimum routing limit

    # Simulate packet loss retransmissions / FEC recovery penalty
    loss_events = np.random.random(size=num_frames) < packet_loss_rate
    fec_penalty = np.where(loss_events, 16.6, 0.0) # 1 frame buffer wait on lost packet

    # Total Motion-to-Photon Latency array
    total_mtp = input_polling + server_render + video_encode + network_one_way + fec_penalty + client_decode + display_refresh

    return {
        "Mean (ms)": round(float(np.mean(total_mtp)), 2),
        "P50 (ms)": round(float(np.percentile(total_mtp, 50)), 2),
        "P95 (ms)": round(float(np.percentile(total_mtp, 95)), 2),
        "P99 (ms)": round(float(np.percentile(total_mtp, 99)), 2),
        "Max Spike (ms)": round(float(np.max(total_mtp)), 2)
    }

if __name__ == "__main__":
    results = simulate_cloud_gaming_latency()
    for metric, val in results.items():
        print(f"{metric}: {val}")
4. Bandwidth, Video Compression, and Visual Quality Dynamics
While latency dominates responsiveness discussions, video compression bitrate governs visual fidelity. Native rendering produces pristine, lossy-free pixel output with 4:4:4 color chroma sampling. Cloud streaming must compress uncompressed 4K video streams—which natively require over 18 Gigabits per second (Gbps)—down to manageable broadband streams ranging between 25 Megabits per second (Mbps) and 75 Mbps.

Compression Codecs & Chroma Subsampling
- H.264 vs H.265 (HEVC) vs AV1: Modern cloud services have largely transitioned from H.264 to H.265 and AV1 codecs. AV1 delivers up to 30% higher compression efficiency at identical bitrates compared to HEVC. This allows cloud services to stream 4K 120 FPS content at ~45 Mbps without noticeable macroblocking in static scenes.
- 4:2:0 Chroma Subsampling: To conserve network bandwidth, real-time hardware encoders convert native 4:4:4 RGB frames to YUV 4:2:0 color space. This discards 75% of color detail while preserving luminance (brightness). While imperceptible in fast-moving action scenes, 4:2:0 subsampling causes noticeable color bleeding around small text elements and fine UI HUD displays.
- Dynamic Bitrate & Packet Recovery: Cloud platforms monitor network congestion using WebRTC adaptive bitrate (ABR) controls and Forward Error Correction (FEC). When jitter occurs, the streaming client dynamically drops stream resolution or bitrate rather than stalling video execution.
JavaScript Adaptive Jitter Buffer Control
Below is a client-side JavaScript snippet demonstrating how modern cloud gaming WebRTC clients dynamically calculate jitter buffers to avoid frame dropping while maintaining minimal delay:
class CloudJitterBufferManager {
  constructor(targetLatencyMs = 20, maxBufferMs = 50) {
    this.targetLatencyMs = targetLatencyMs;
    this.maxBufferMs = maxBufferMs;
    this.jitterSamples = [];
    this.currentBufferMs = targetLatencyMs;
  }

  recordPacketArrival(expectedTimeMs, actualTimeMs) {
    const delta = Math.abs(actualTimeMs - expectedTimeMs);
    this.jitterSamples.push(delta);

    if (this.jitterSamples.length > 50) {
      this.jitterSamples.shift();
    }

    this.adaptBuffer();
  }

  adaptBuffer() {
    const avgJitter = this.jitterSamples.reduce((a, b) => a + b, 0) / this.jitterSamples.length;
    const sorted = [...this.jitterSamples].sort((a, b) => a - b);
    const p95Jitter = sorted[Math.floor(sorted.length * 0.95)] || avgJitter;

    this.currentBufferMs = Math.min(
      Math.max(this.targetLatencyMs, p95Jitter * 1.5),
      this.maxBufferMs
    );

    return this.currentBufferMs;
  }
}

const jitterManager = new CloudJitterBufferManager();
jitterManager.recordPacketArrival(1000, 1004);
console.log(`Updated Buffer: ${jitterManager.currentBufferMs.toFixed(2)} ms`);
5. Total Cost of Ownership (TCO) & Economic Comparison
The economic debate between native hardware ownership and cloud subscriptions hinges on Capital Expenditures (CapEx) versus Operational Expenditures (OpEx). Native PC hardware requires significant upfront investment but provides zero ongoing subscription fees and dual-use workstation utility. Cloud gaming eliminates hardware barrier to entry in exchange for recurring monthly fees and perpetual dependence on robust internet service.
5-Year Total Cost of Ownership Matrix (2026-2031)
| Cost Component | Custom High-End PC Rig | Next-Gen Console (PS5/Xbox) | Cloud Gaming (GFN Ultimate Tier) |
|---|---|---|---|
| Initial Hardware CapEx | $2,200.00 (RTX 4080/5080, CPU, RAM) | $499.00 (Console hardware) | $0.00 (Using existing laptop/TV/phone) |
| Peripherals & Display | $500.00 (240Hz Gaming Monitor, Mouse/KB) | $150.00 (Extra Controller + Headset) | $60.00 (Basic Bluetooth Controller) |
| 5-Year Subscription Fees | $0.00 | $480.00 (Console Online Pass @ $8/mo) | $1,199.40 (GeForce NOW @ $19.99/mo) |
| 5-Year Electricity Cost (Est.) | $360.00 (450W avg @ 2 hrs/day, $0.16/kWh) | $160.00 (200W avg) | $25.00 (15W client decoder) |
| Hardware Depreciation & Residual Value | -$600.00 (Estimated resale after 5 yrs) | -$150.00 (Resale value) | $0.00 (No physical asset owned) |
| NET 5-YEAR TOTAL COST | $2,460.00 | $1,139.00 | $1,284.40 |
Key Financial Takeaway: Cloud gaming provides a dramatic cost efficiency advantage over premium native PC hardware, saving consumers over $1,100 across a 5-year timeline while delivering comparable RTX 4080/5080 visual performance tiers. However, dedicated gaming consoles remain remarkably competitive economically, sitting at roughly equal long-term expenditure compared to premium cloud subscriptions when factoring in online access charges.
6. Market Dynamics, Ecosystems, and 2026–2030 Outlook
As telecommunication infrastructure advances, the boundaries between native hardware and cloud streaming are rapidly blurring into hybrid ecosystems.
Technological Enablers Shaping the Next Decade
- 5G Standalone (SA) Network Slicing: 5G Standalone networks enable telecom operators to allocate dedicated virtual network slices tailored specifically for real-time cloud gaming traffic. By enforcing Ultra-Reliable Low-Latency Communication (URLLC) guarantees, network slicing mitigates cell tower congestion latency spikes.
- Wi-Fi 7 (802.11be) Multi-Link Operation (MLO): Wi-Fi 7 allows client devices to send and receive data across multiple frequency bands (2.4 GHz, 5 GHz, and 6 GHz) simultaneously. This eliminates local wireless latency jitter, making home Wi-Fi virtually indistinguishable from wired Ethernet for cloud streams.
- Server-Side AI Frame Generation: By integrating real-time neural network frame generation (such as NVIDIA DLSS 3.5/4.0) directly into cloud encoding pipelines, server GPUs can render at 60 FPS while streaming a silky-smooth 120 FPS or 240 FPS video feed to the client, effectively cutting required server rendering time in half.
Market Growth & Consumer Adoption Segmentation
Market forecasts indicate that the global cloud gaming market revenue will expand at a Compound Annual Growth Rate (CAGR) exceeding 32% from 2024 to 2030. Growth is predominantly propelled by mobile-first territories, TV-integrated cloud apps (such as Samsung Gaming Hub and LG webOS integrations), and portable handheld devices (e.g., Logitech G Cloud, Steam Deck cloud streaming mode).
However, native hardware will remain dominant in high-stakes competitive esports disciplines (First-Person Shooters like Counter-Strike 2, VALORANT, and Apex Legends) where sub-15ms motion-to-photon latency is non-negotiable for professional performance.
7. Frequently Asked Questions (FAQ)
What internet speed is required for high-performance cloud gaming?
For 1080p 60 FPS streaming, a stable connection of at least 25 Mbps is recommended. For 4K 120 FPS HDR streaming (e.g., GeForce NOW Ultimate), providers recommend 45 Mbps to 75 Mbps. Crucially, low ping (under 30ms RTT) and low jitter (under 3ms) are far more critical than raw bandwidth.
Can cloud gaming replace native PC hardware for competitive esports?
For casual and semi-competitive gameplay, modern high-framerate cloud tiers offer exceptionally low latency that feels crisp. However, for professional esports players where every millisecond matters, native PC hardware operating at 240Hz to 540Hz directly over DisplayPort remains superior due to zero network transit delay.
How does cloud gaming handle video compression artifacts in dark scenes?
Video compression algorithms (H.265/AV1) heavily compress dark, low-contrast gradients to conserve bandwidth, which can cause subtle color banding. Modern services mitigate this by deploying higher bitrates, AV1 10-bit encoding, and client-side post-processing sharpen filters.
Does cloud gaming consume significant monthly broadband data?
Yes. High-quality 4K cloud streaming can consume between 15 GB and 25 GB of data per hour. Users with ISP data caps (such as 1.2 TB monthly caps) should monitor usage carefully or opt for unlimited internet plans.
Do players own their games on cloud gaming platforms?
It depends on the platform model. Bring-Your-Own-Game (BYOG) services like GeForce NOW link directly to your existing Steam, Epic Games, and Xbox digital libraries, ensuring you retain full game ownership. Subscription-catalog platforms like Xbox Game Pass or Amazon Luna grant access to rotating libraries as long as your membership remains active.
8. Final Verdict & Strategic Decision Matrix
The choice between cloud gaming and native hardware is no longer a simple binary of compromise versus capability. Instead, it is a strategic decision dictated by network topology, gaming preferences, and budget structure:
- Choose Native PC Hardware if: You compete in high-framerate esports, demand uncompressed 4K visual perfection with zero color artifacting, perform heavy workstation tasks (3D rendering, video editing, local AI model training), or live in regions with unreliable broadband.
- Choose Cloud Gaming if: You want access to top-tier Ray Tracing GPU graphics without spending thousands on hardware upgrades, value frictionless play across smart TVs, ultra-thin laptops, and mobile devices, or prefer operational flexibility over physical asset ownership.
- Choose a Native Console if: You desire plug-and-play local performance, exclusive titles, and fixed physical hardware at a highly accessible upfront price point.
As fiber rollouts expand, 5G SA network slicing matures, and hardware AV1 decoding becomes ubiquitous, cloud gaming will continue its relentless ascent from a peripheral alternative to a dominant mainstream gaming paradigm.
Tags: cloud gaming, native hardware, latency analysis, gpu virtualization, 5g, webrtc, market outlook